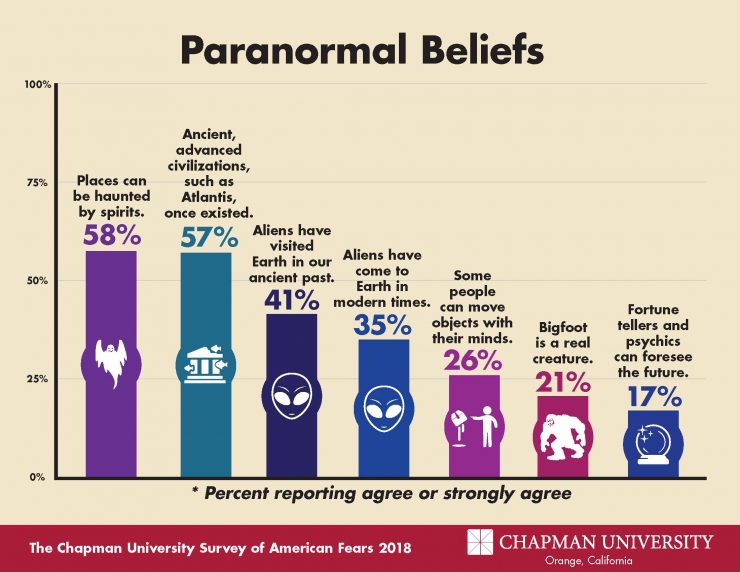
As you may recall, last year I developed a survey to collect information on Canadian beliefs in the supernatural, paranormal, cryptozoological, and pseudoarchaeological. Inspired by and modified from the Chapman Survey of American Fears (specifically their paranormal section), I wanted to gain some insight into whether or not Canadians believe in these topics. We can see from the Chapman survey that American beliefs are on the rise, but do Canadians believe on the same scale? I also wanted to look at social media use. More specifically, where on social media are Canadians being exposed to these topics? This survey was conducted in preparation for my Shannon Lecture at Carleton University last October, where I shared some of my results. Now that I have a spot of free time to sit down and write, I decided it’s time to share those results here. Because I’m planning on sharing a lot of graphics visually displaying the information, I’m going to try to limit the amount of text I include around them. Hopefully the graphs will speak for themselves! I’m also not going to share everything I collected (because there is a lot and a lot I can do with it), but instead I’ll be sharing highlights from each of the 3 sections of the survey.
As a quick reminder, I opened the call for responses to anyone who was interested, however I made it clear that I was mostly interested in responses from Canadians. I won’t go into the breakdown of the definition of identifying as “Canadian”, but I did include it within the survey and trust that respondents were being truthful. I ended up with a total of 210 responses. After weeding out those who didn’t meet the “Canadian” criteria, I had 196 responses to analyze. Not a massive number when compared to the Chapman survey, which gets over 1000 responses, but still a good chunk of data to look at. In breaking down the responses, that total number for analysis will change a bit because I left all the questions optional to answer, meaning sometimes people chose not to answer certain questions. That all being said, I’m still excited I managed to get over 200 responses for my first time running this survey! I’m already planning on running it again in the fall to see if beliefs have changed at all. Hopefully the number of responses will keep growing!
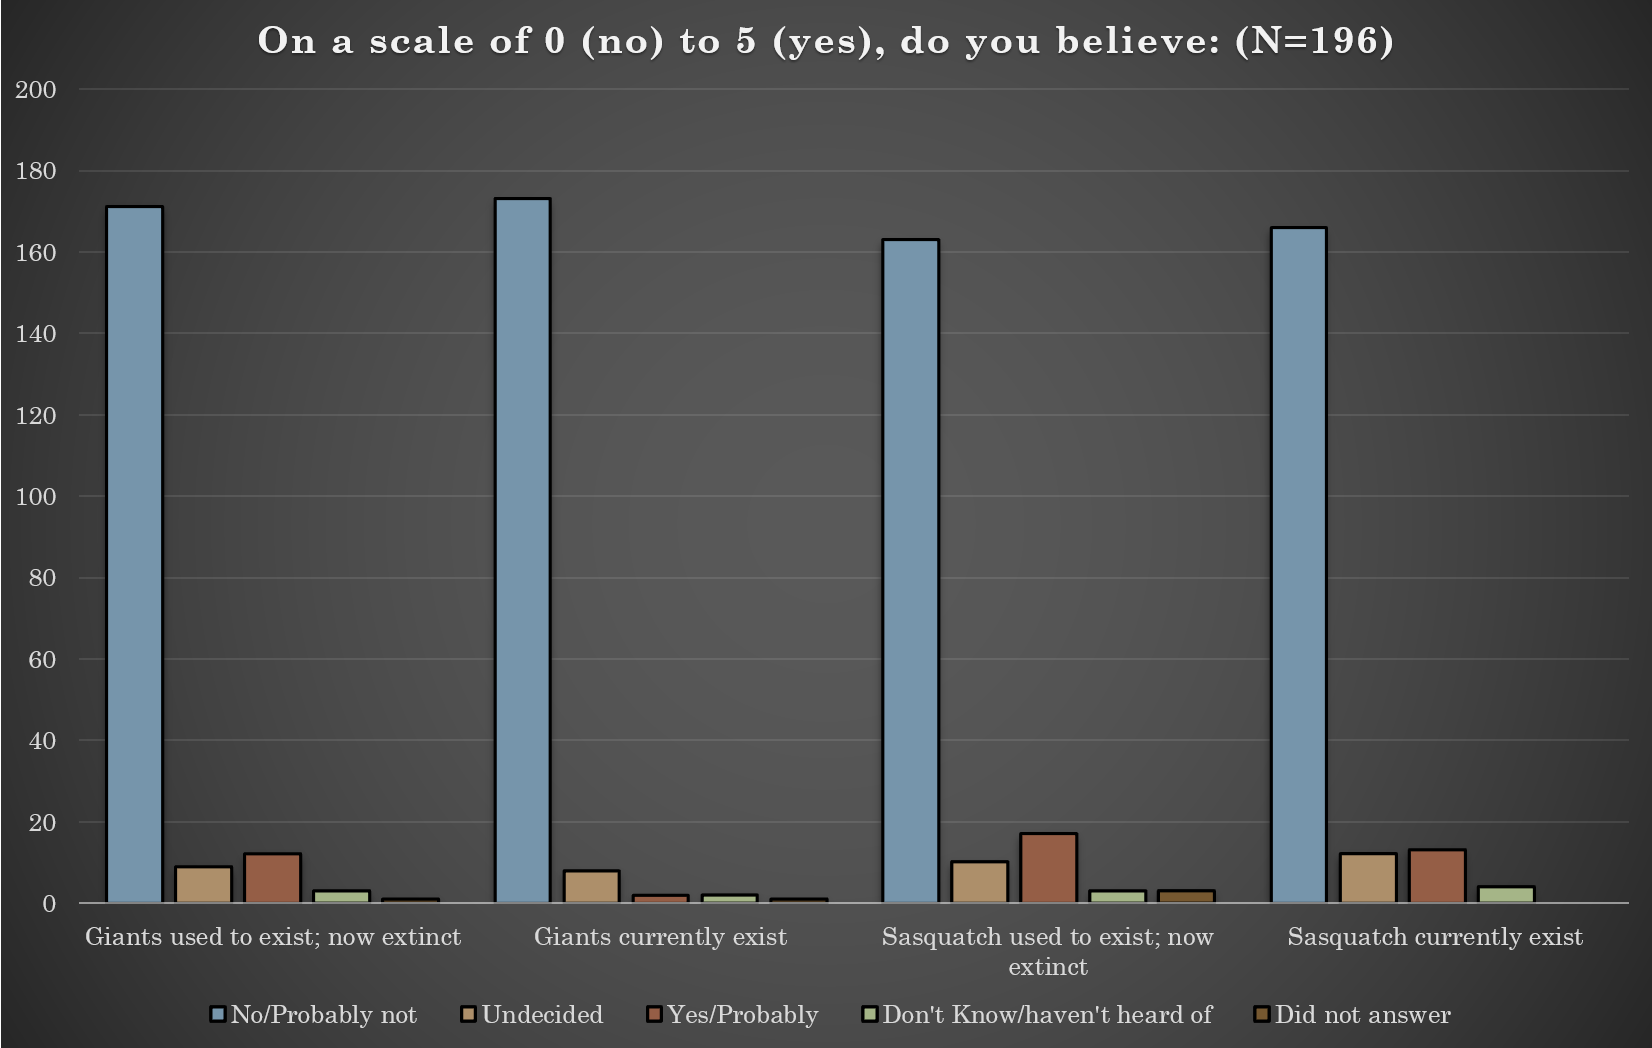
Since by this point in this post you’ve just seen the table showing the breakdown of American beliefs, let’s look at the equivalent for Canadian beliefs (spoiler: it’s not as visually pleasing at the Chapman graph, sorry). These questions made up the first section of my survey looking specifically at what we do and do not believe in. Apparently we’re really into hauntings!

I didn’t limit myself to only the same questions as on the Chapman survey. I also added many additional questions on related topics I thought would be interesting to look into. Being Canadian I had to throw in a question about Oak Island, NS. But I’m kicking myself for not including anything to do with vikings. Next time, perhaps. Here’s the breakdown on questions and responses below (click on the image to expand it):
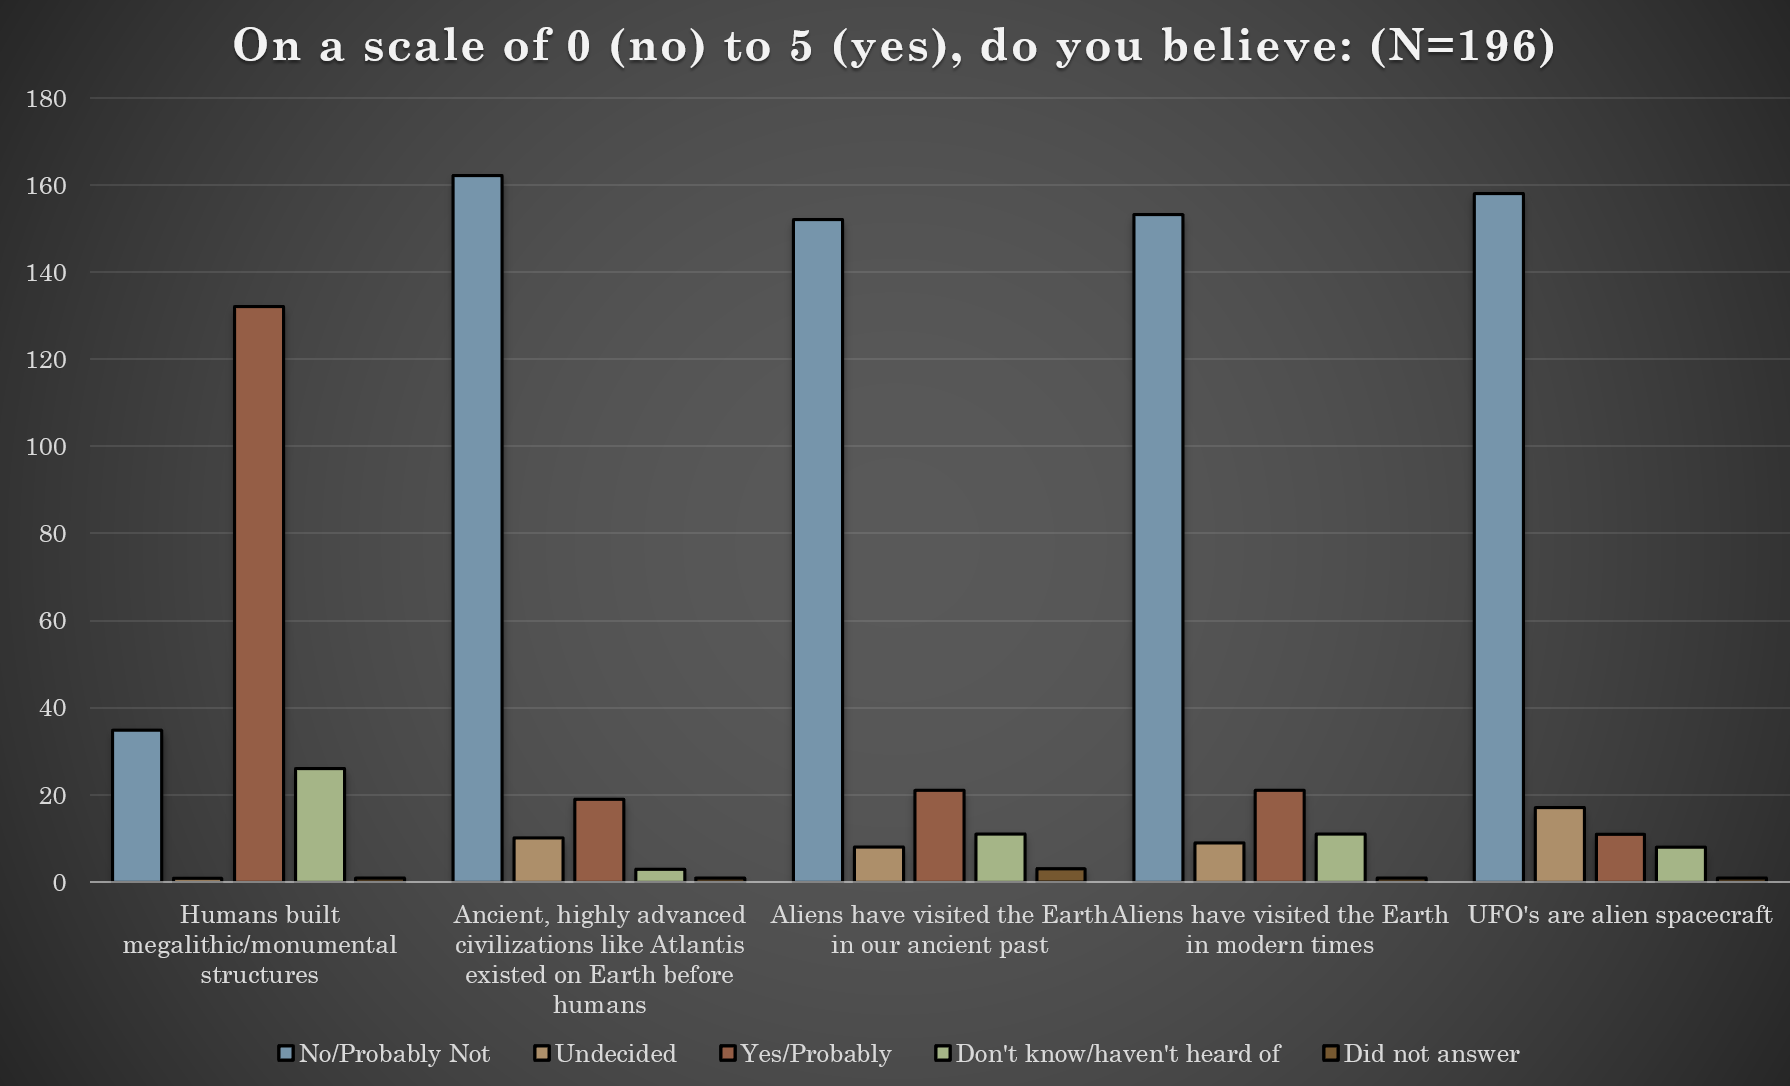


I was admittedly quite surprised by the responses to my question on believing that humans built large stone structures (i.e. pyramids) themselves. 18% of respondents do not think humans built large stone structures themselves. It was the largest number of “Strongly disagree” and “Disagree” responses this section of my survey received. So now the question is: who do they believe built these structures?

The second section of my survey was interested in looking at social media use. What kinds of social media are we using? And on which social media platforms are we finding videos/stories/articles, etc. related to the topics above? The number of responses here are much larger and variable due to individuals using multiple social media platforms. Let’s take a look at the breakdowns (click on the image to expand them):


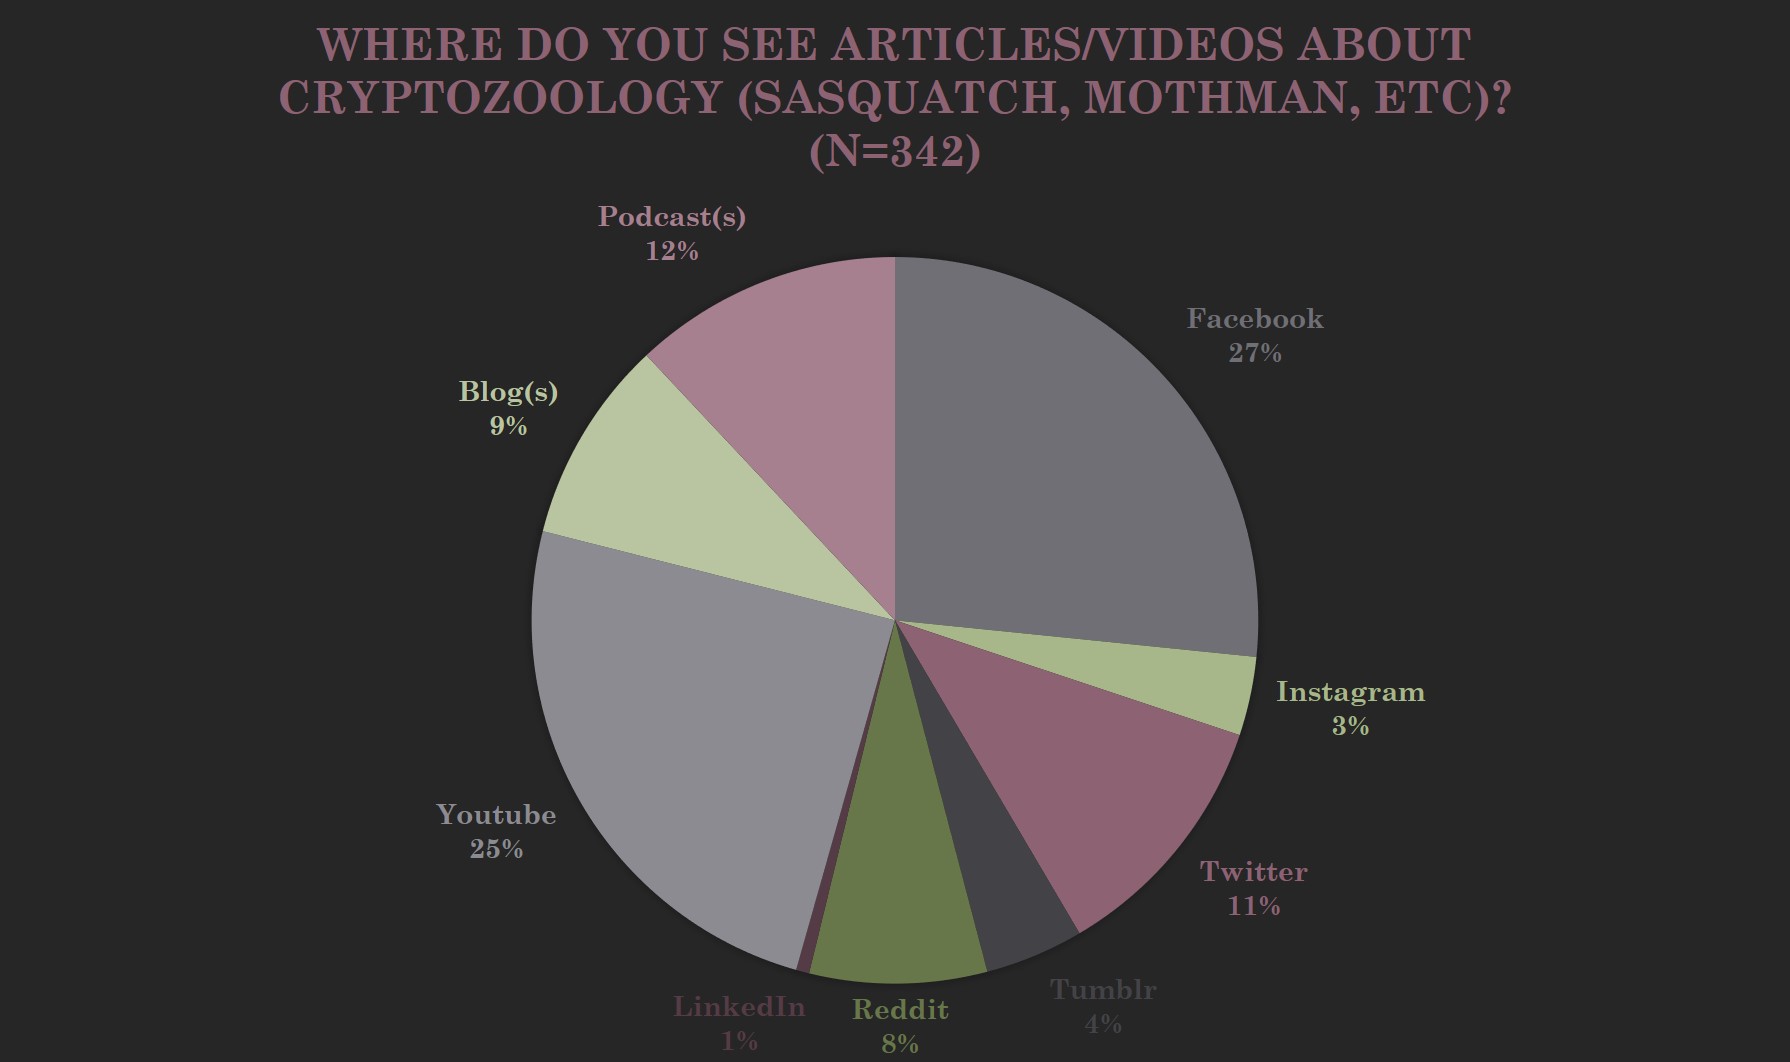
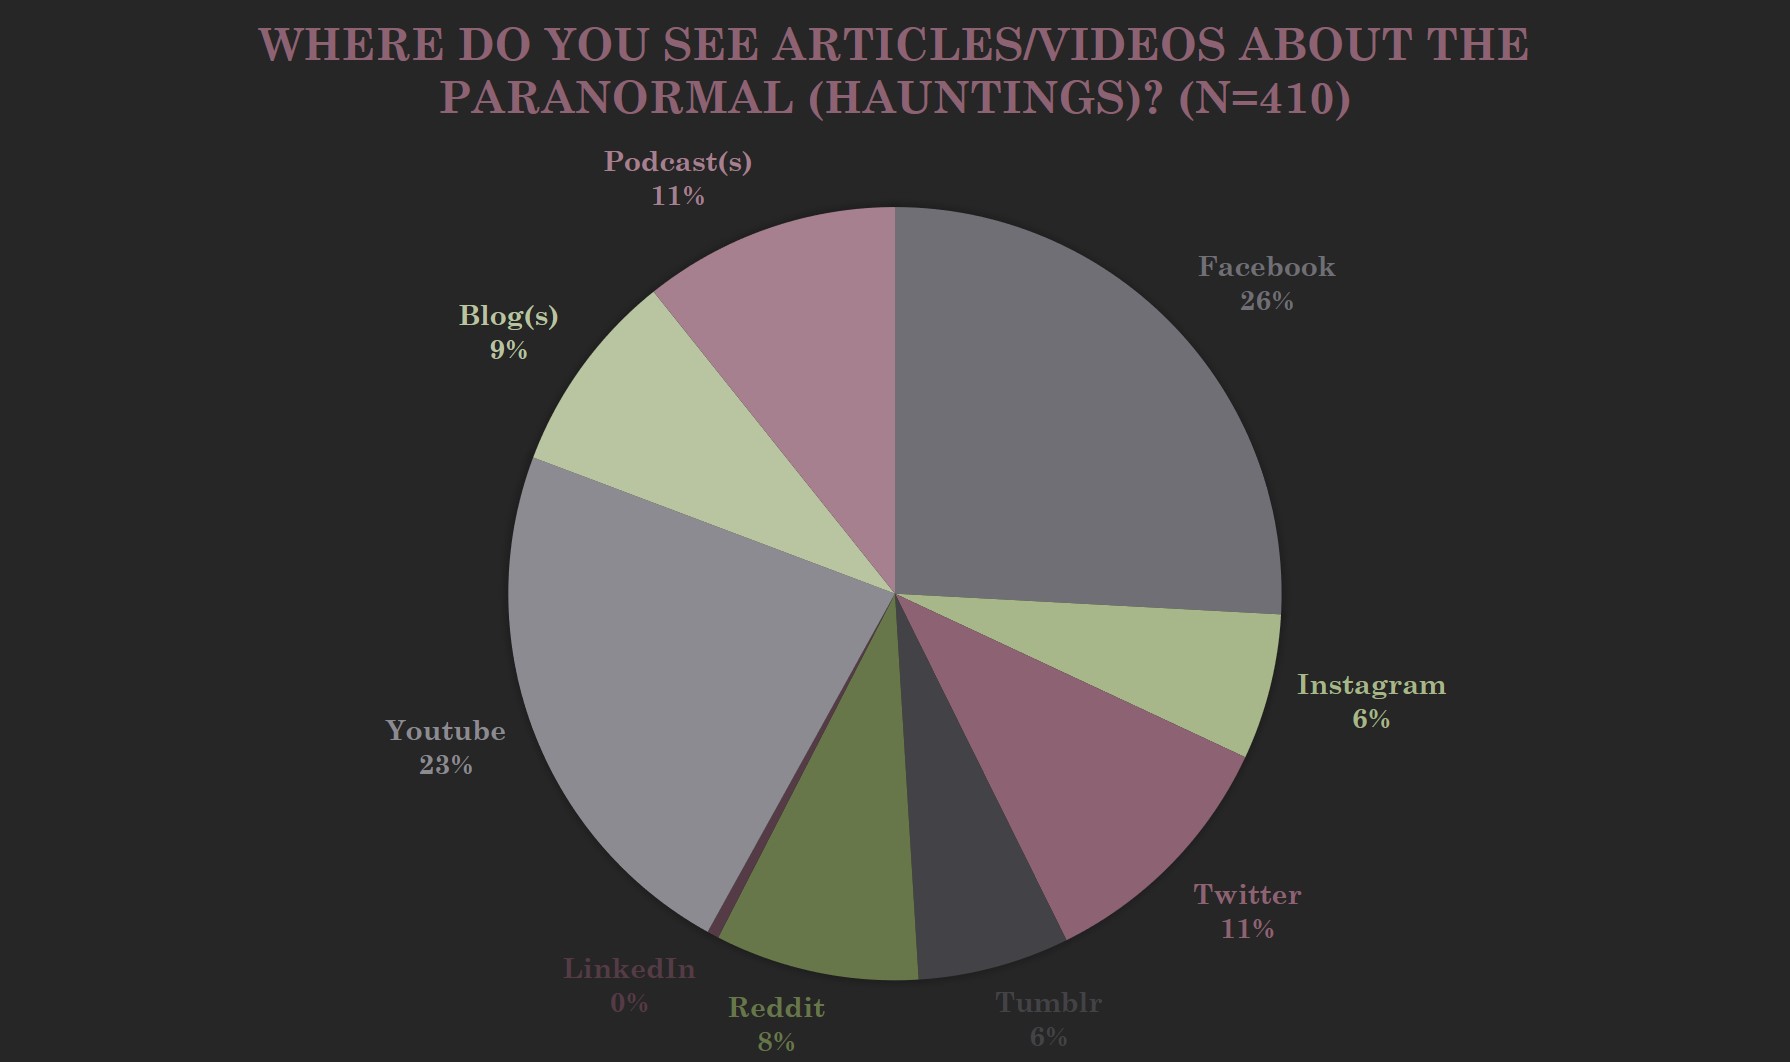

In all cases, Facebook was the #1 culprit for exposing people to these topics. To be honest, that shouldn’t be surprising given that Facebook is still the most-used social media platform around the world with 2.271 billion (yes, billion) actively monthly users. Also, one recent study has found that Facebook users over the age of 65 years old were most likely to spread misinformation during the 2016 USA presidential election. In response, Facebook appears to be trying to take some sort of action to slow the spread of fake news on their platform, but only time will tell if this will be effective or not. I’m curious now to look closer into the age range of Facebook users as it’s related to sharing information on the topics in my study. Future goals.
The third and final section of my survey was looking at conspiracies related to these topics. Specifically, the idea of cover-ups since in pseudoarchaeology it’s common to hear the claim that someone or an institution is hiding or covering-up some sort of information. Take a look below at the breakdown: (click on image to enlarge):

For these questions I had also left some room for people to explain some of their answers (which are included as “Other”), and there were a lot of really great responses. Some responses highlighted how sometimes archaeological and/or historical information was invented to justify colonialism and racism. Others talked about how information had been withheld due to scientists being muzzled by their governments or institutions. Some pointed out that sometimes archaeologists aren’t allowed to reveal sensitive information, like site location and burial information. It was also interesting to see how conflicted we are with trusting our governments compared to archaeologists and museums/institutions.
So that’s all I really have to share with you today. As I’ve already mentioned, I have a lot more data than what I’ve shared here that will need a lot more work to make any informative sense out of it. There is plenty more I can do and that I would like to do, like run correlations. For example, the chart below is a sample of some correlations. So, for example, if someone believes that places/locations can be haunted, are they likely to also believe that aliens have visited the Earth in ancient times? The larger/darker the circle, the more likely someone is to believe something. Keep your eyes open in the future for more results like these to be shared!


One thought on “A Survey on Canadian Beliefs – The Results”